Published: 4 August 2023
Accessible Data
Data is something that I don't tend to consciously think much about but I don't think I have worked in any role where data wasn't really important.
As a teacher, I worked daily with data that focussed on children's progress and learning. We had numerous Excel spreadsheets that tracked progress each half term, what level each child had reached in each subject and whether they were making sufficient progress to be on track to achieve the expected levels in their Key Stage 2 SATs.
In adult learning, we had similar Excel spreadsheets for tracking courses, course numbers, finances and other performance targets. We also had dedicated database applications for storing customer information and personal data. It was while I was working there that the General Data Protection Regulation (GDPR) came in, and with it, a lot of conscious thought about how personal data is used and stored.
Now I'm thinking about data from an accessibility perspective. We have lots of data in Government and to help colleagues process it, we use several data visualisation tools. The more I think about data visualisation, the more concerned I become about accessibility.
5 Accessibility Issues with Data
How to describe visuals
For many people, graphs, charts and other colourful visual representations of data are really helpful in understanding and interpreting data. A table full of names and numbers can look pretty daunting but when that same information is given in a visual format, it brings it to life.
For other people though, visualisations can cause major accessibility issues. Think about someone who is blind, someone with low vision, someone who cannot differentiate between different colours. By their very nature, visualisations are visual. They are designed for people who can see. So we need to think about how blind and visually impaired people can access them.
Normally, when you have an image or other non-text content, you would describe it using alt text. Alt text should be brief and should provide a screen reader user with enough detail to know what the image is and why it is there. This is more difficult to do with complex images such as data visualisations.
For complex images, brief alt text should tell the user what the general purpose of the image is, but then it will also need a long description. The long description should give much more detailed information about the image, including any text, labels, numbers and relative sizes. This long description should be in normal text and it can be in a different location (with a clear link) or on the same page.
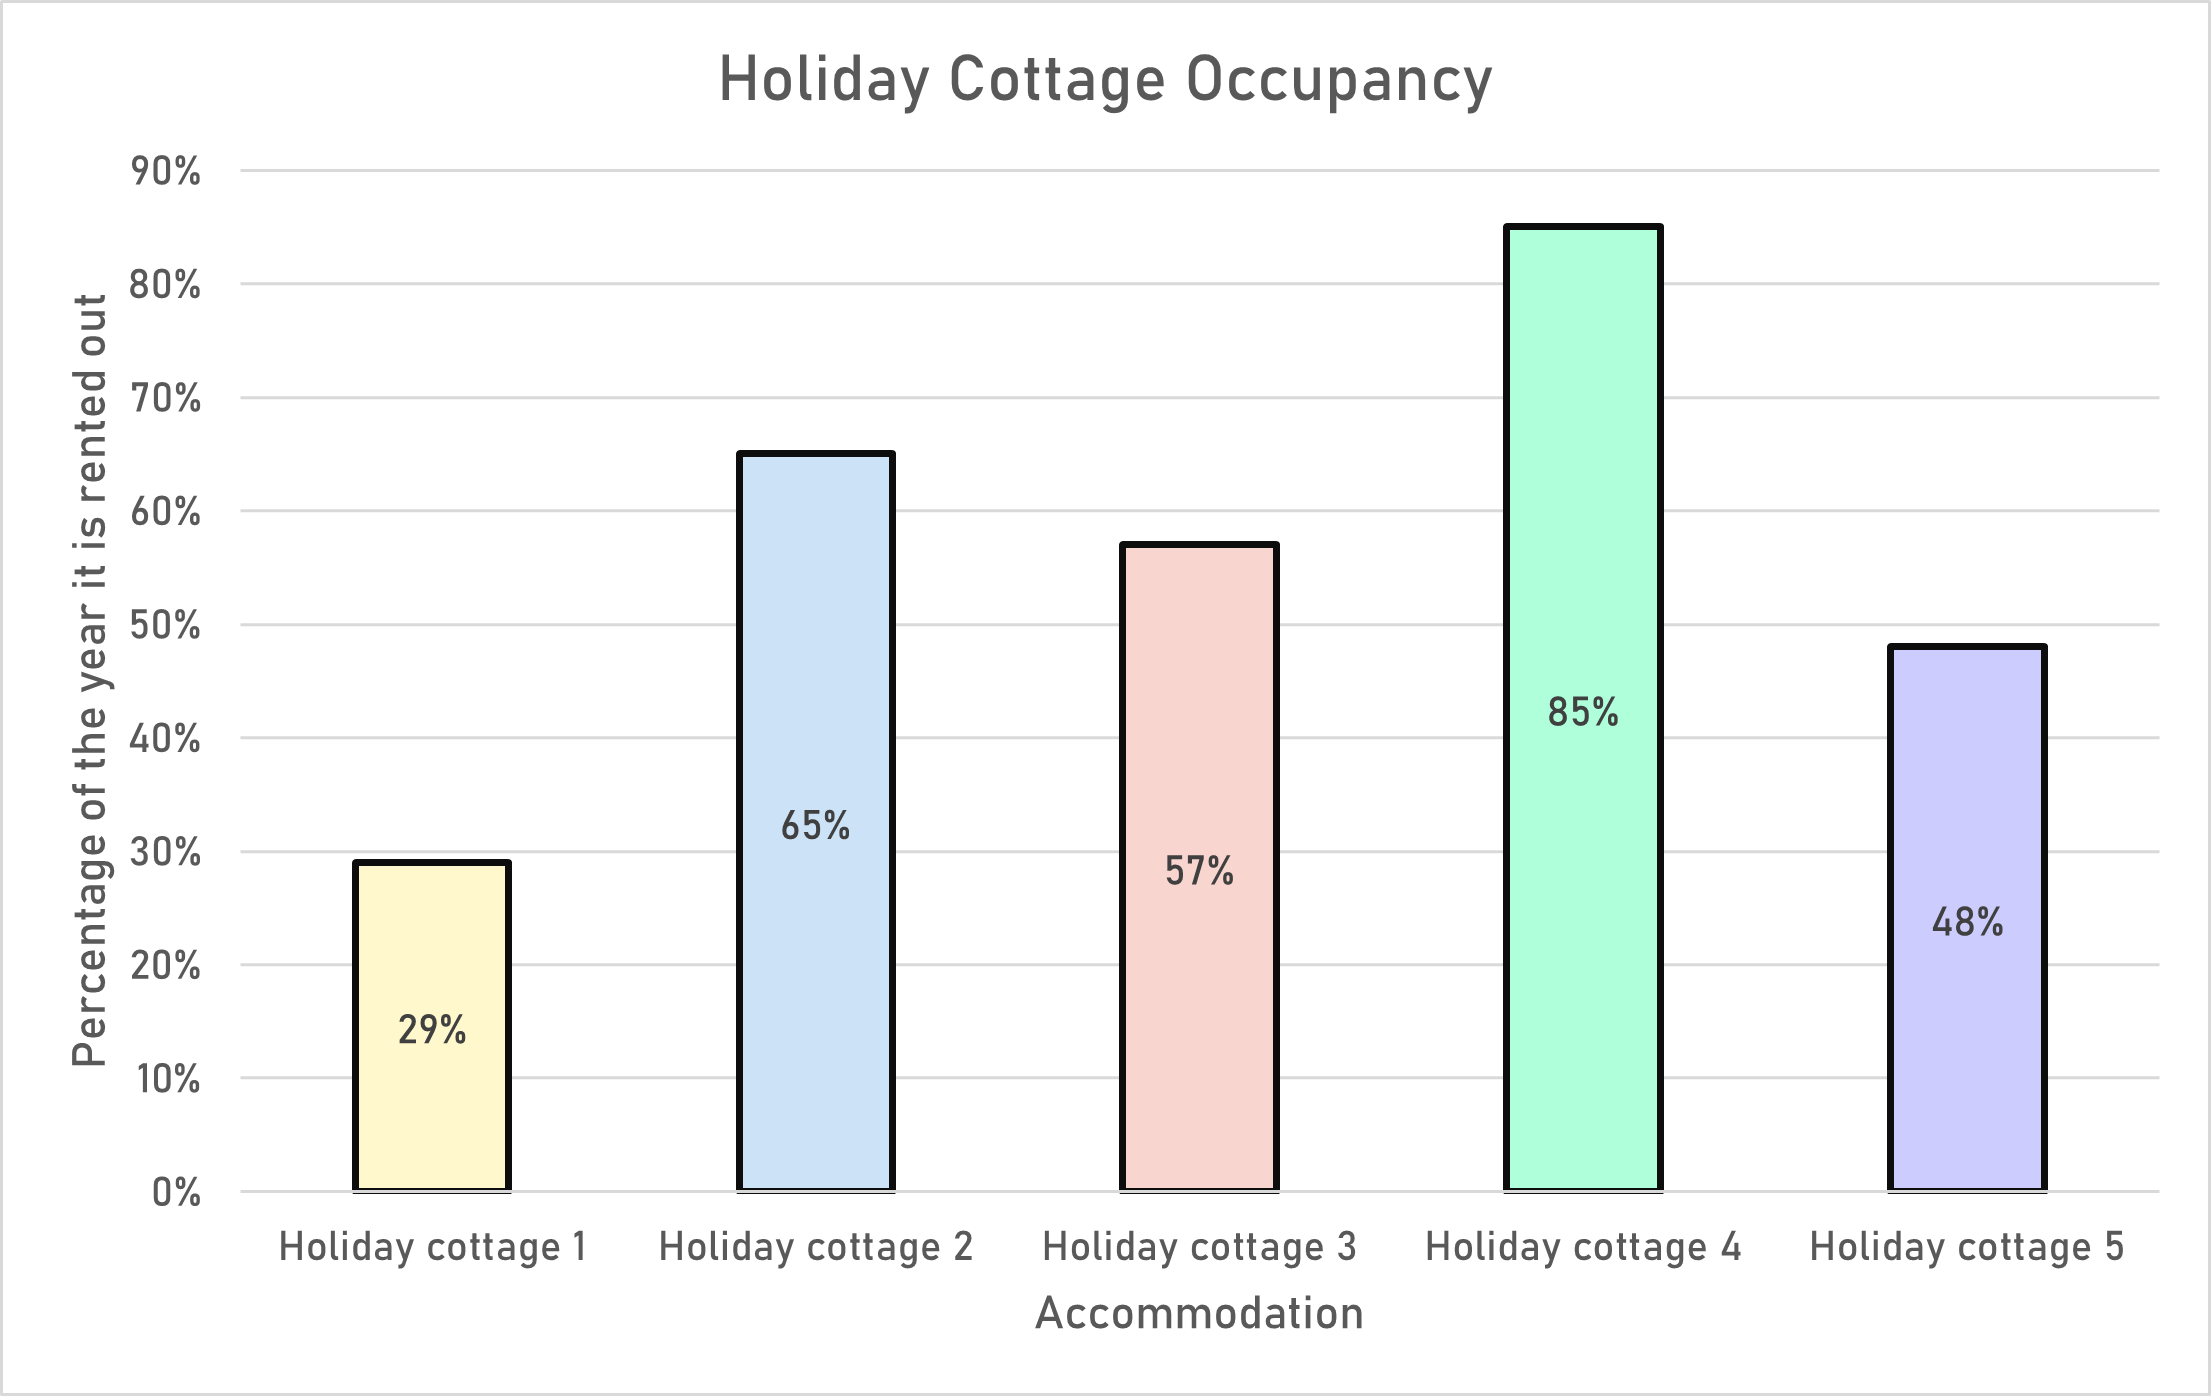
Description of graph: There are five holiday cottages, numbered sequentially from 1 to 5. Their occupancy rates are: 29%, 65%, 57%, 85% and 48% respectfully. So Holiday Cottage 4 is the most popular and Holiday Cottage 1 is the least popular.
Use of colour
There are two basic rules around the use of colour. The first rule is that colour should never be the only way of giving information. There should always be another way of perceiving the same information. The second rule is that it must meet minimum contrast ratios. This can be between the foreground and background colours but also between adjacent colours, e.g. in a pie chart.
Colour doesn't have to be the only way of giving information. It is quite easy to avoid this problem. Let's imagine a bar graph. Each bar on the graph is a different colour. There are two ways of letting the user know what each colour represents. One is to label each bar, either on the axis or on the bar itself, or both. The other is to use a key. The former method allows a person who cannot perceive colour to still know what each bar represents. The latter does not. So it is really important to put the information in text on the graph itself.
The following two images illustrate the difference between the two ways of doing this:
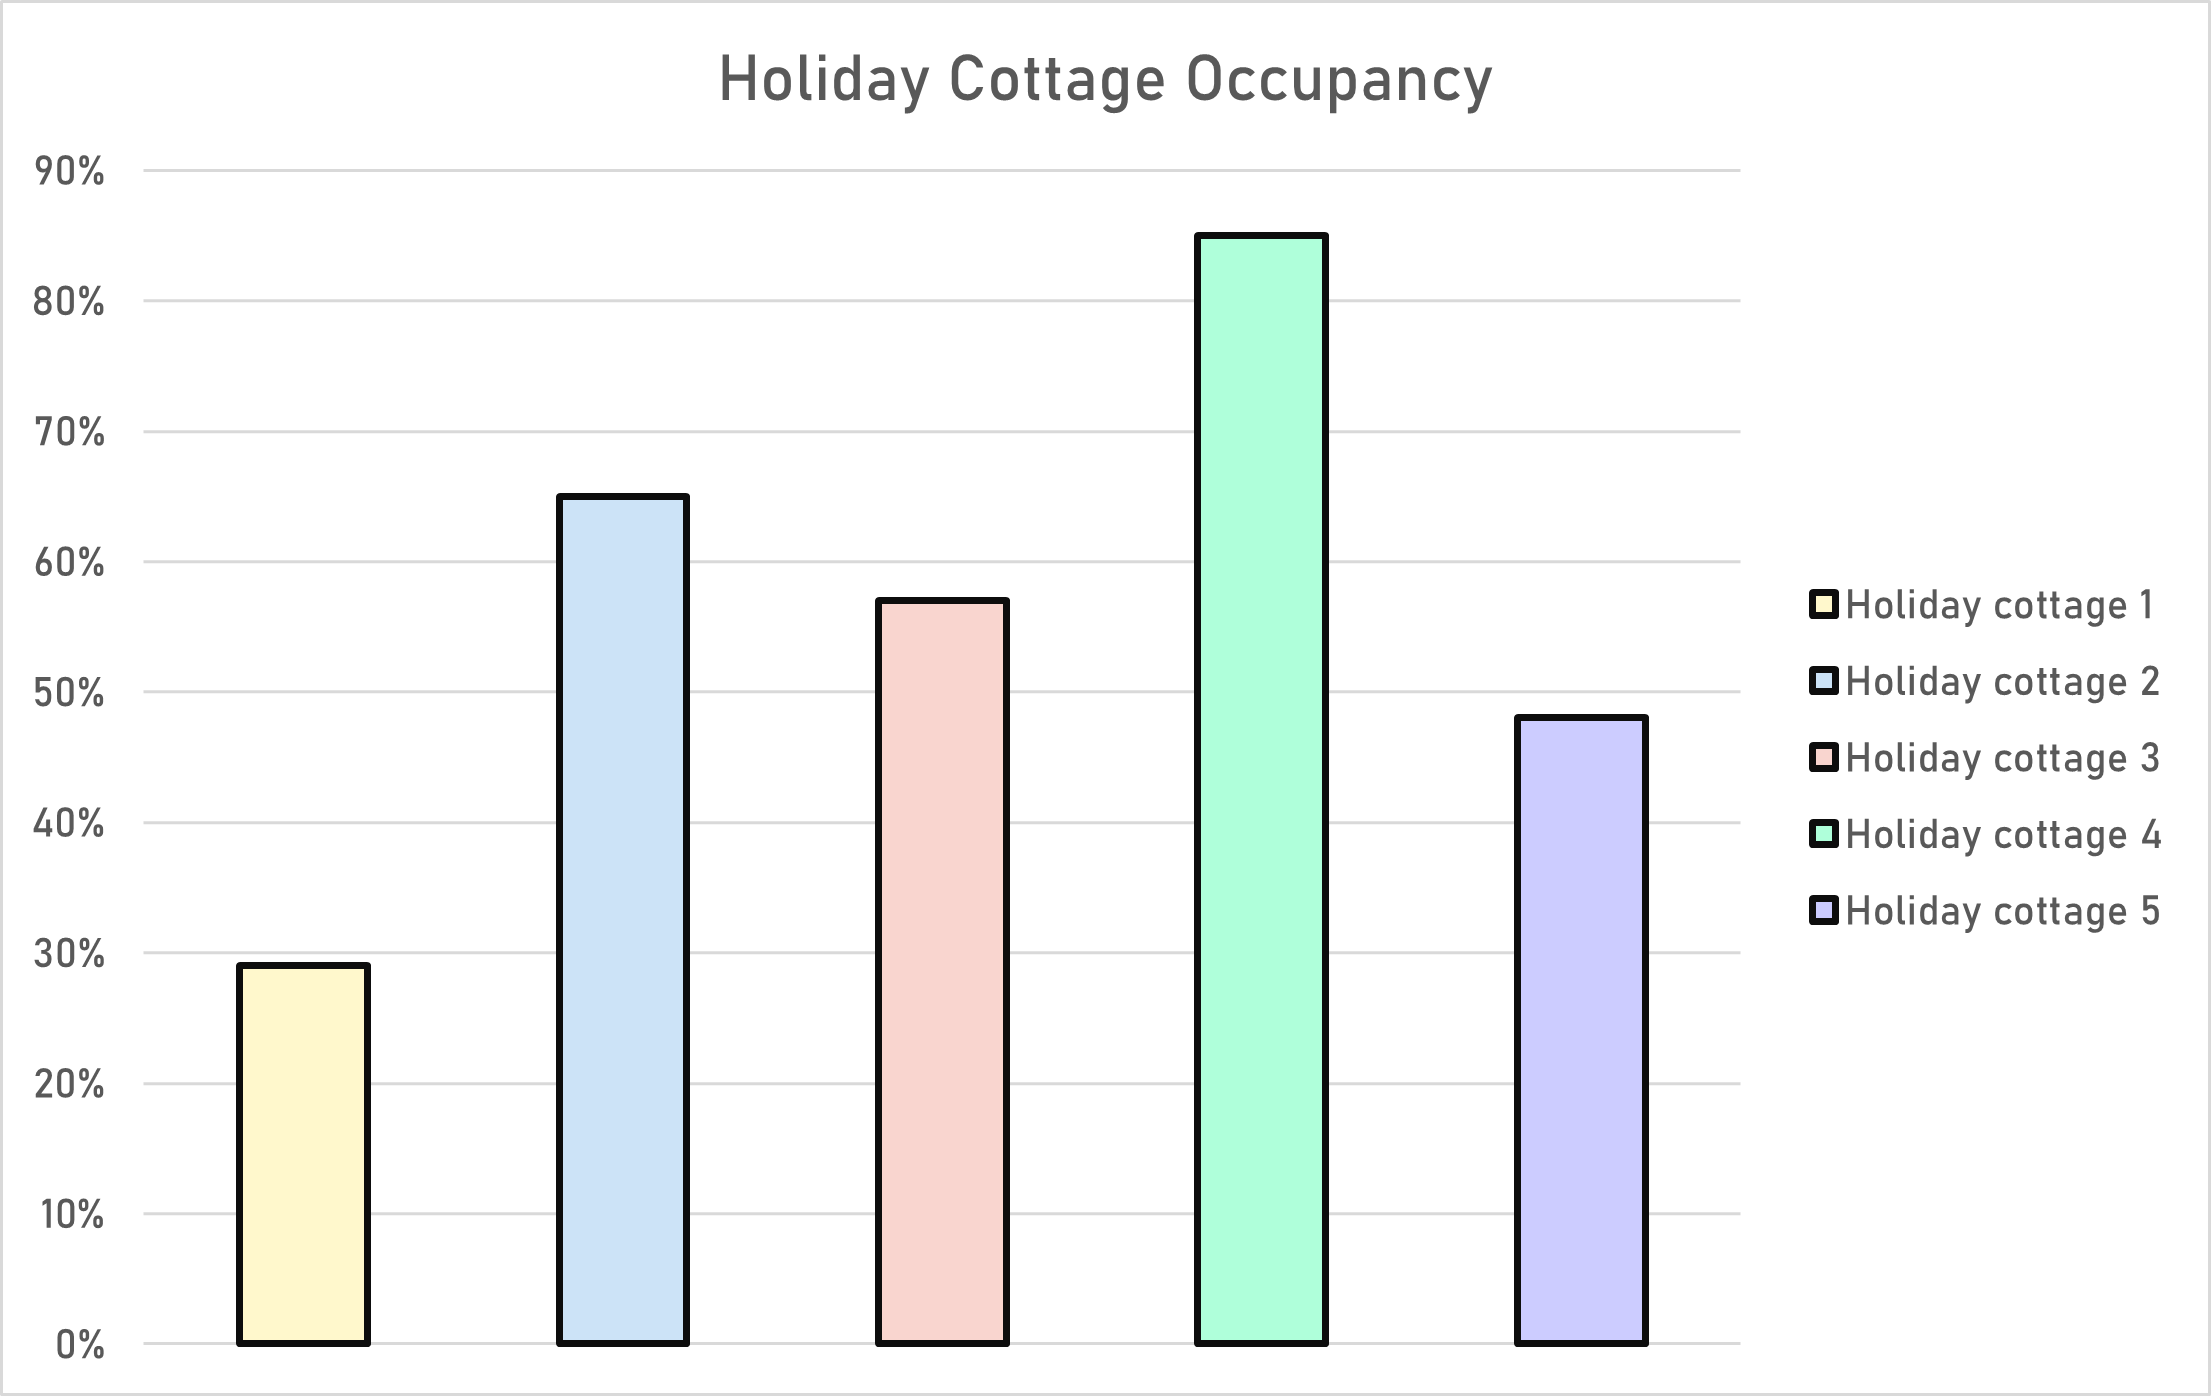
Colour contrast is one of the most common defects I see in data visualisations. It can be really difficult to tell the difference between colours that don't have sufficient contrast. On a graph or chart, one way to make this easier is to either go for bold, dark colours and give each section a white border, or go for lighter colours and give each section a black border. It can also help to have a small amount of space between sections, to help users see which is which.
Navigation
Then we need to consider people who can't use a mouse. The different sections of many graphs and charts offer additional information when you hover a mouse over them. They need to work for people who can't use a mouse too. This is clearly one of the most difficult things to achieve, as I have just been looking at WebAIM's most recent survey results, the WebAIM Million Report ![]() . That has some pretty graphs, which show the information on mouse hover. However, when I started to tab through with keyboard, none of the graphs are keyboard accessible.
. That has some pretty graphs, which show the information on mouse hover. However, when I started to tab through with keyboard, none of the graphs are keyboard accessible.
I'm going to work (for now) on the assumption that if WebAIM haven't managed to achieve it, it is because it is really really difficult to do, if not impossible. However, once I've finished this blog post, I'm going to do some more research into this and see whether it is possible to create keyboard accessible and screen reader friendly graphs that disabled people can actually interact with.
Reading order
Some of the data visualisation tools I have seen recently at work have an awful lot of information on a page. They are dashboard style products, where everything is laid out on a kind of grid with different graphs and charts which can be selected to access more detailed information. I haven't had the opportunity yet to explore any of these with a screen reader but one of the things I wonder, is whether the information reads in anything like a logical order. For data to be accessible, this would be essential.
Raw data
I've saved this one until last, but I toyed with starting with raw data because the data usually comes first. You can't create any visualisations without first having the raw data. I said earlier, by nature, data visualisations are visual. For some people, they help to process the raw data but for others, the raw data is more meaningful. Oh no! A conflict of needs. What to do?
The obvious answer, I think, is to always provide both the raw data and the visualisation. That way, the user can access whichever they find most useful. The raw data will probably be best provided in a table, so of course, it is crucial to ensure that tables are marked up correctly and are fully accessible.
As an example, here is the data from the bar graphs I used earlier to illustrate use of colour.
| Accommodation | Occupancy |
|---|---|
| Holiday Cottage 1 | 29% |
| Holiday Cottage 2 | 65% |
| Holiday Cottage 3 | 57% |
| Holiday Cottage 4 | 85% |
| Holiday Cottage 5 | 48% |
Summary
We are living in a world where data is a valuable commodity. Everywhere we turn, data is being obtained, processed and presented. Accessibility of data is a real challenge. I'll be honest, it's an area that is a little scary for me. I'm going to have to expand my knowledge and learn some new skills. I'm going to have to apply them in vastly different situations. It will be a tough challenge. One thing I am sure of though, is that it will be worth it. When an assistive software user at work, one day tells me they've had a really positive experience with a data application, it will be worth every ounce of effort. Until then, there's work to be done...